Data compression in IIS, Apache and NGINX
Some of our users are residing in areas with very slow or/and metered internet connection, so the amount of data transferred is very important to them. And since web servers do support data compression, enabling it can certainly improve the situation for such users.

We took IIS, Apache and NGINX and ran some tests to see how compression is configured in each of them and to compare how well do they do it.
Environment
The tests were performed on Windows (IIS, Apache and NGINX) and on Linux (Apache and NGINX) servers. The servers hardware was pretty much the same (virtual machines with similar configuration).
The web servers were ran one after another, being binded to the same 80 port.
Servers
Windows:
- Windows 10.0.17763.1369
- IIS 10.0.17763.1
- Apache 2.4.46
- NGINX 1.18.0
- NTFS
Linux:
- Ubuntu 18.04.5 LTS
- Apache 2.4.29
- NGINX 1.19.1
- ext4
Data
The data for tests was a web application with Emscripten/WASM and binary data (3D visualization scene and models), 876 MB in total.
Client
- Windows 10.0.18363.997
- Microsoft Edge Dev 86.0.594.1
- caching was disabled
- the page was reloaded for every test with “Empty Cache and Hard Refresh” option
- Microsoft Edge Dev 86.0.594.1
How to enable compression
IIS
In IIS Manager select the website you want to enable compression for (or just the Default Web Site), open Compression item and check Enable static content compression.
Now open Configuration Editor and edit the following sections there.
Section system.webServer/serverRuntime:
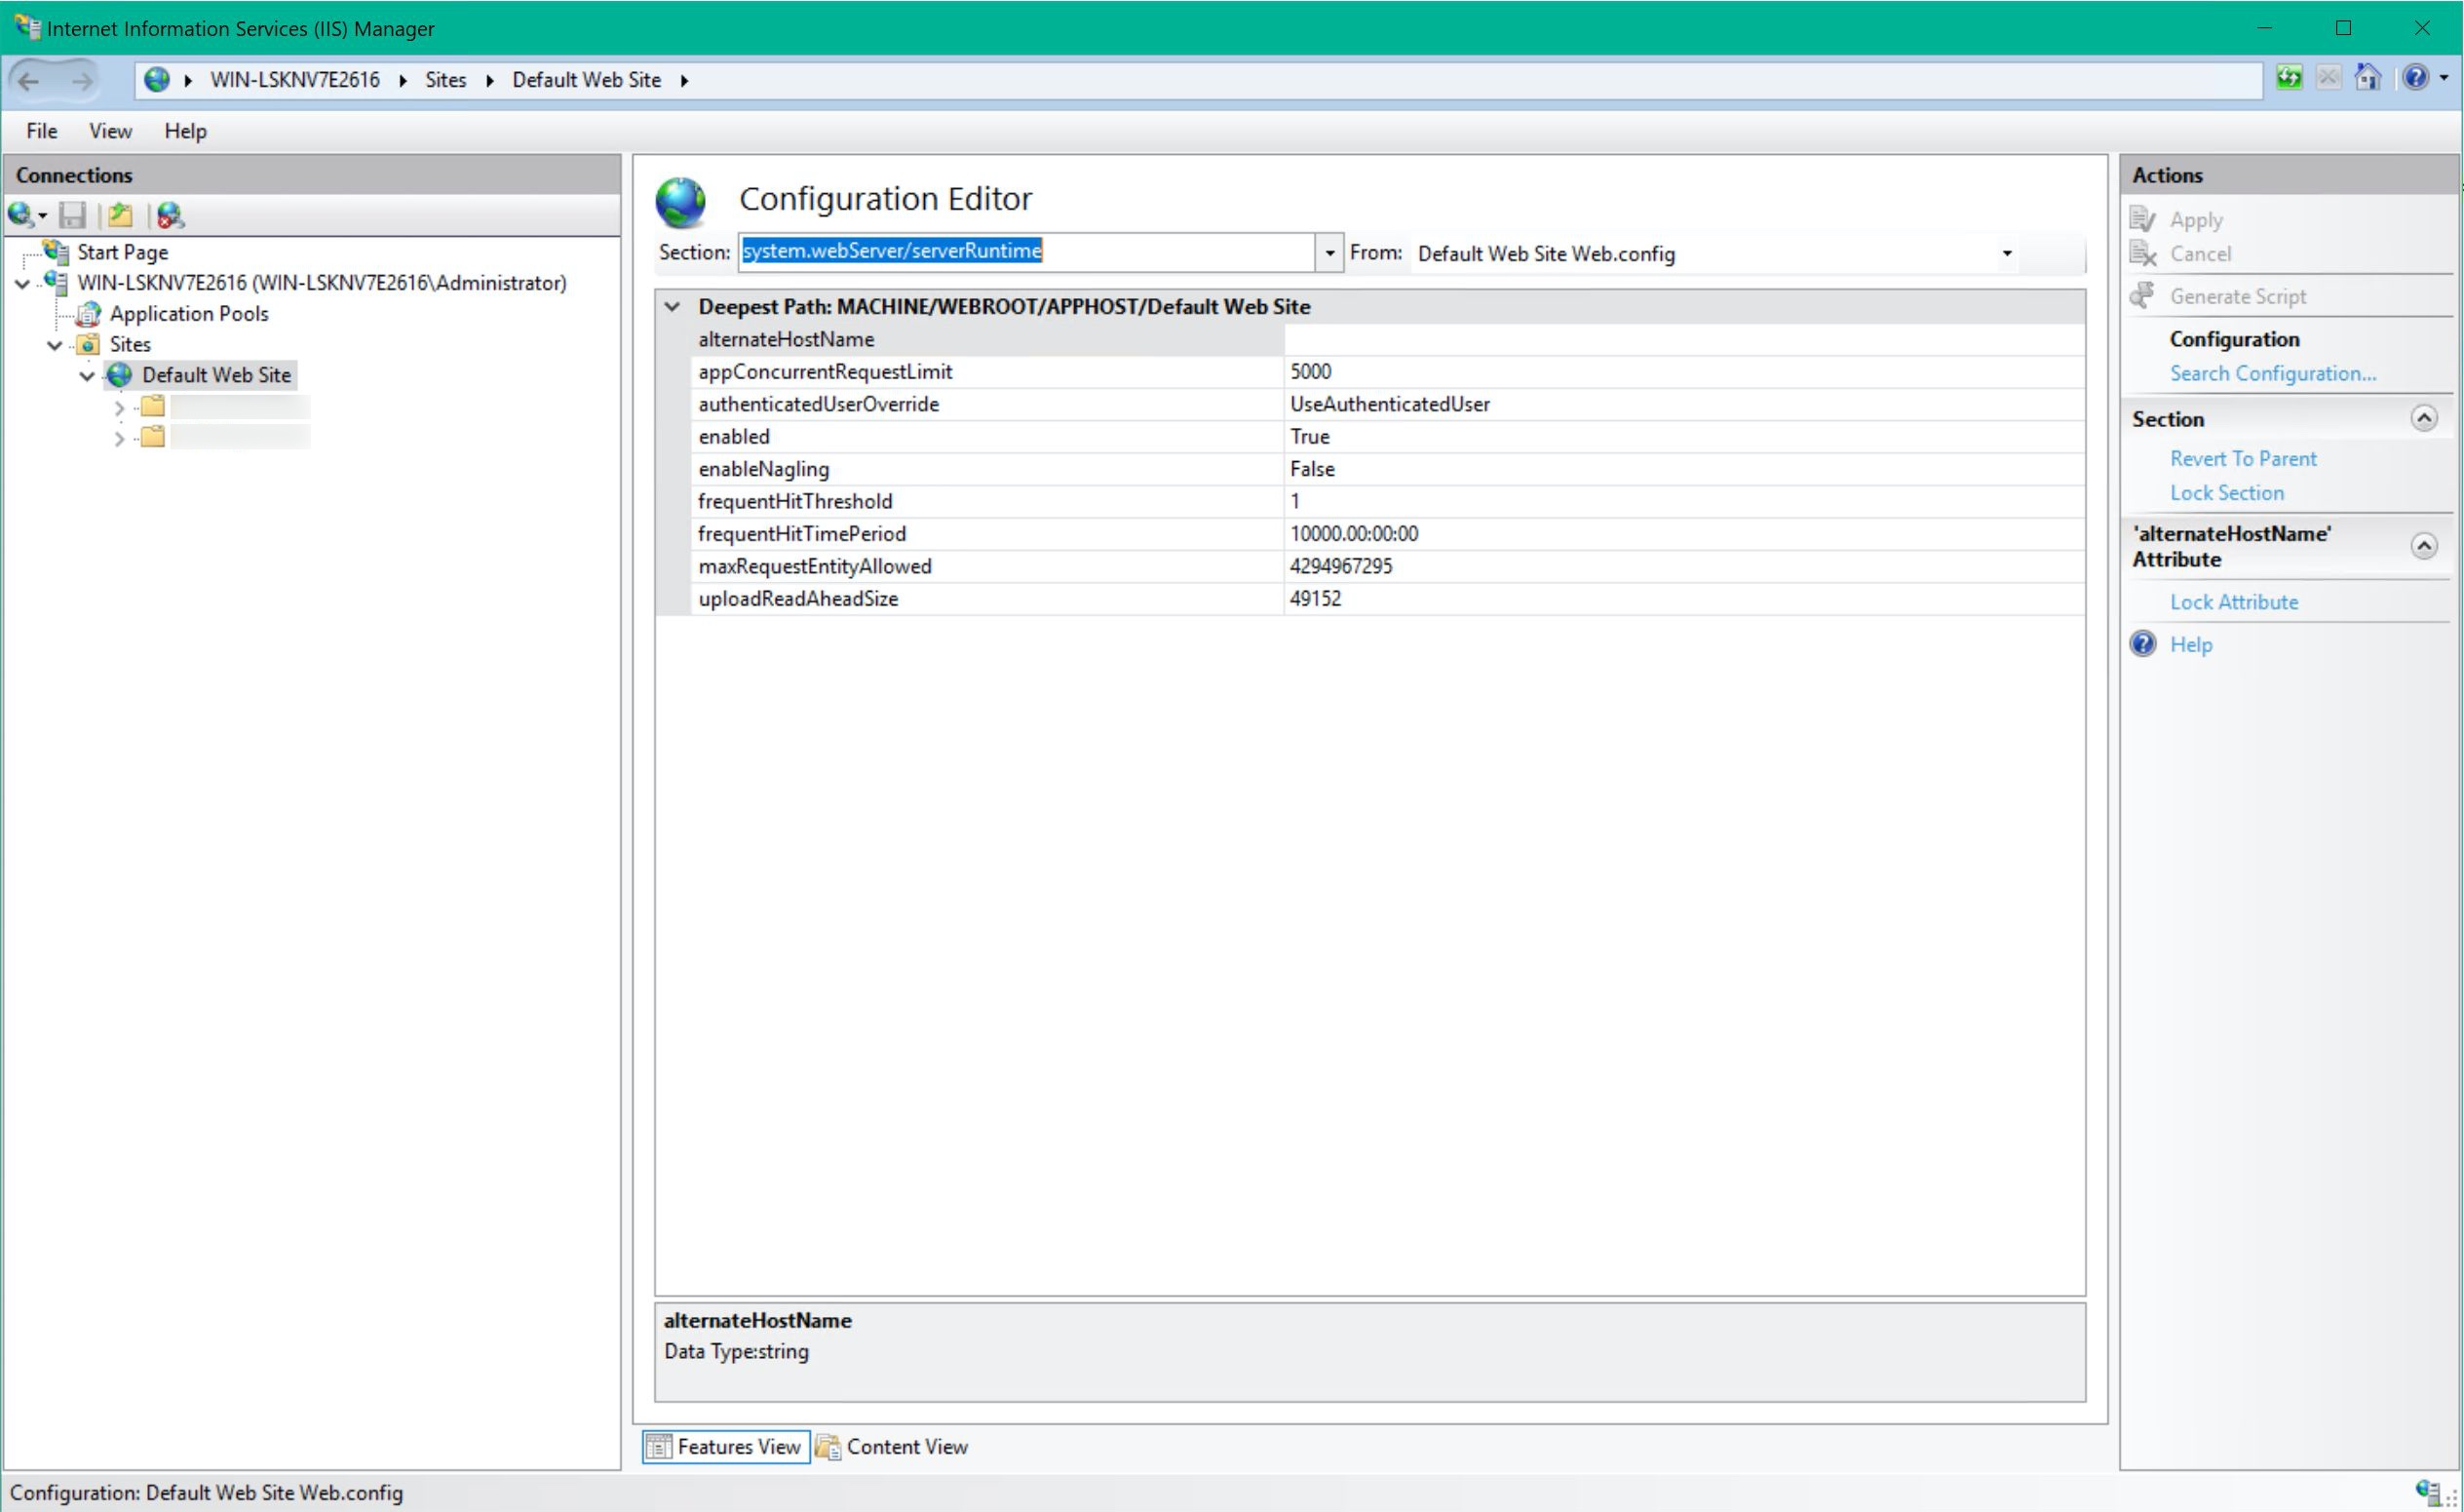
- click the
Unlock Section - set
frequentHitThresholdto1. This turned out to be an important setting as with values above1the IIS will be trying to be clever and compress only the responses he thinks are for frequent enough requests - change
frequentHitTimePeriodfrom00:00:10to something like10000.00:00:00(but perhaps settingfrequentHitThresholdto1is enough)
Section system.webServer/httpCompression:
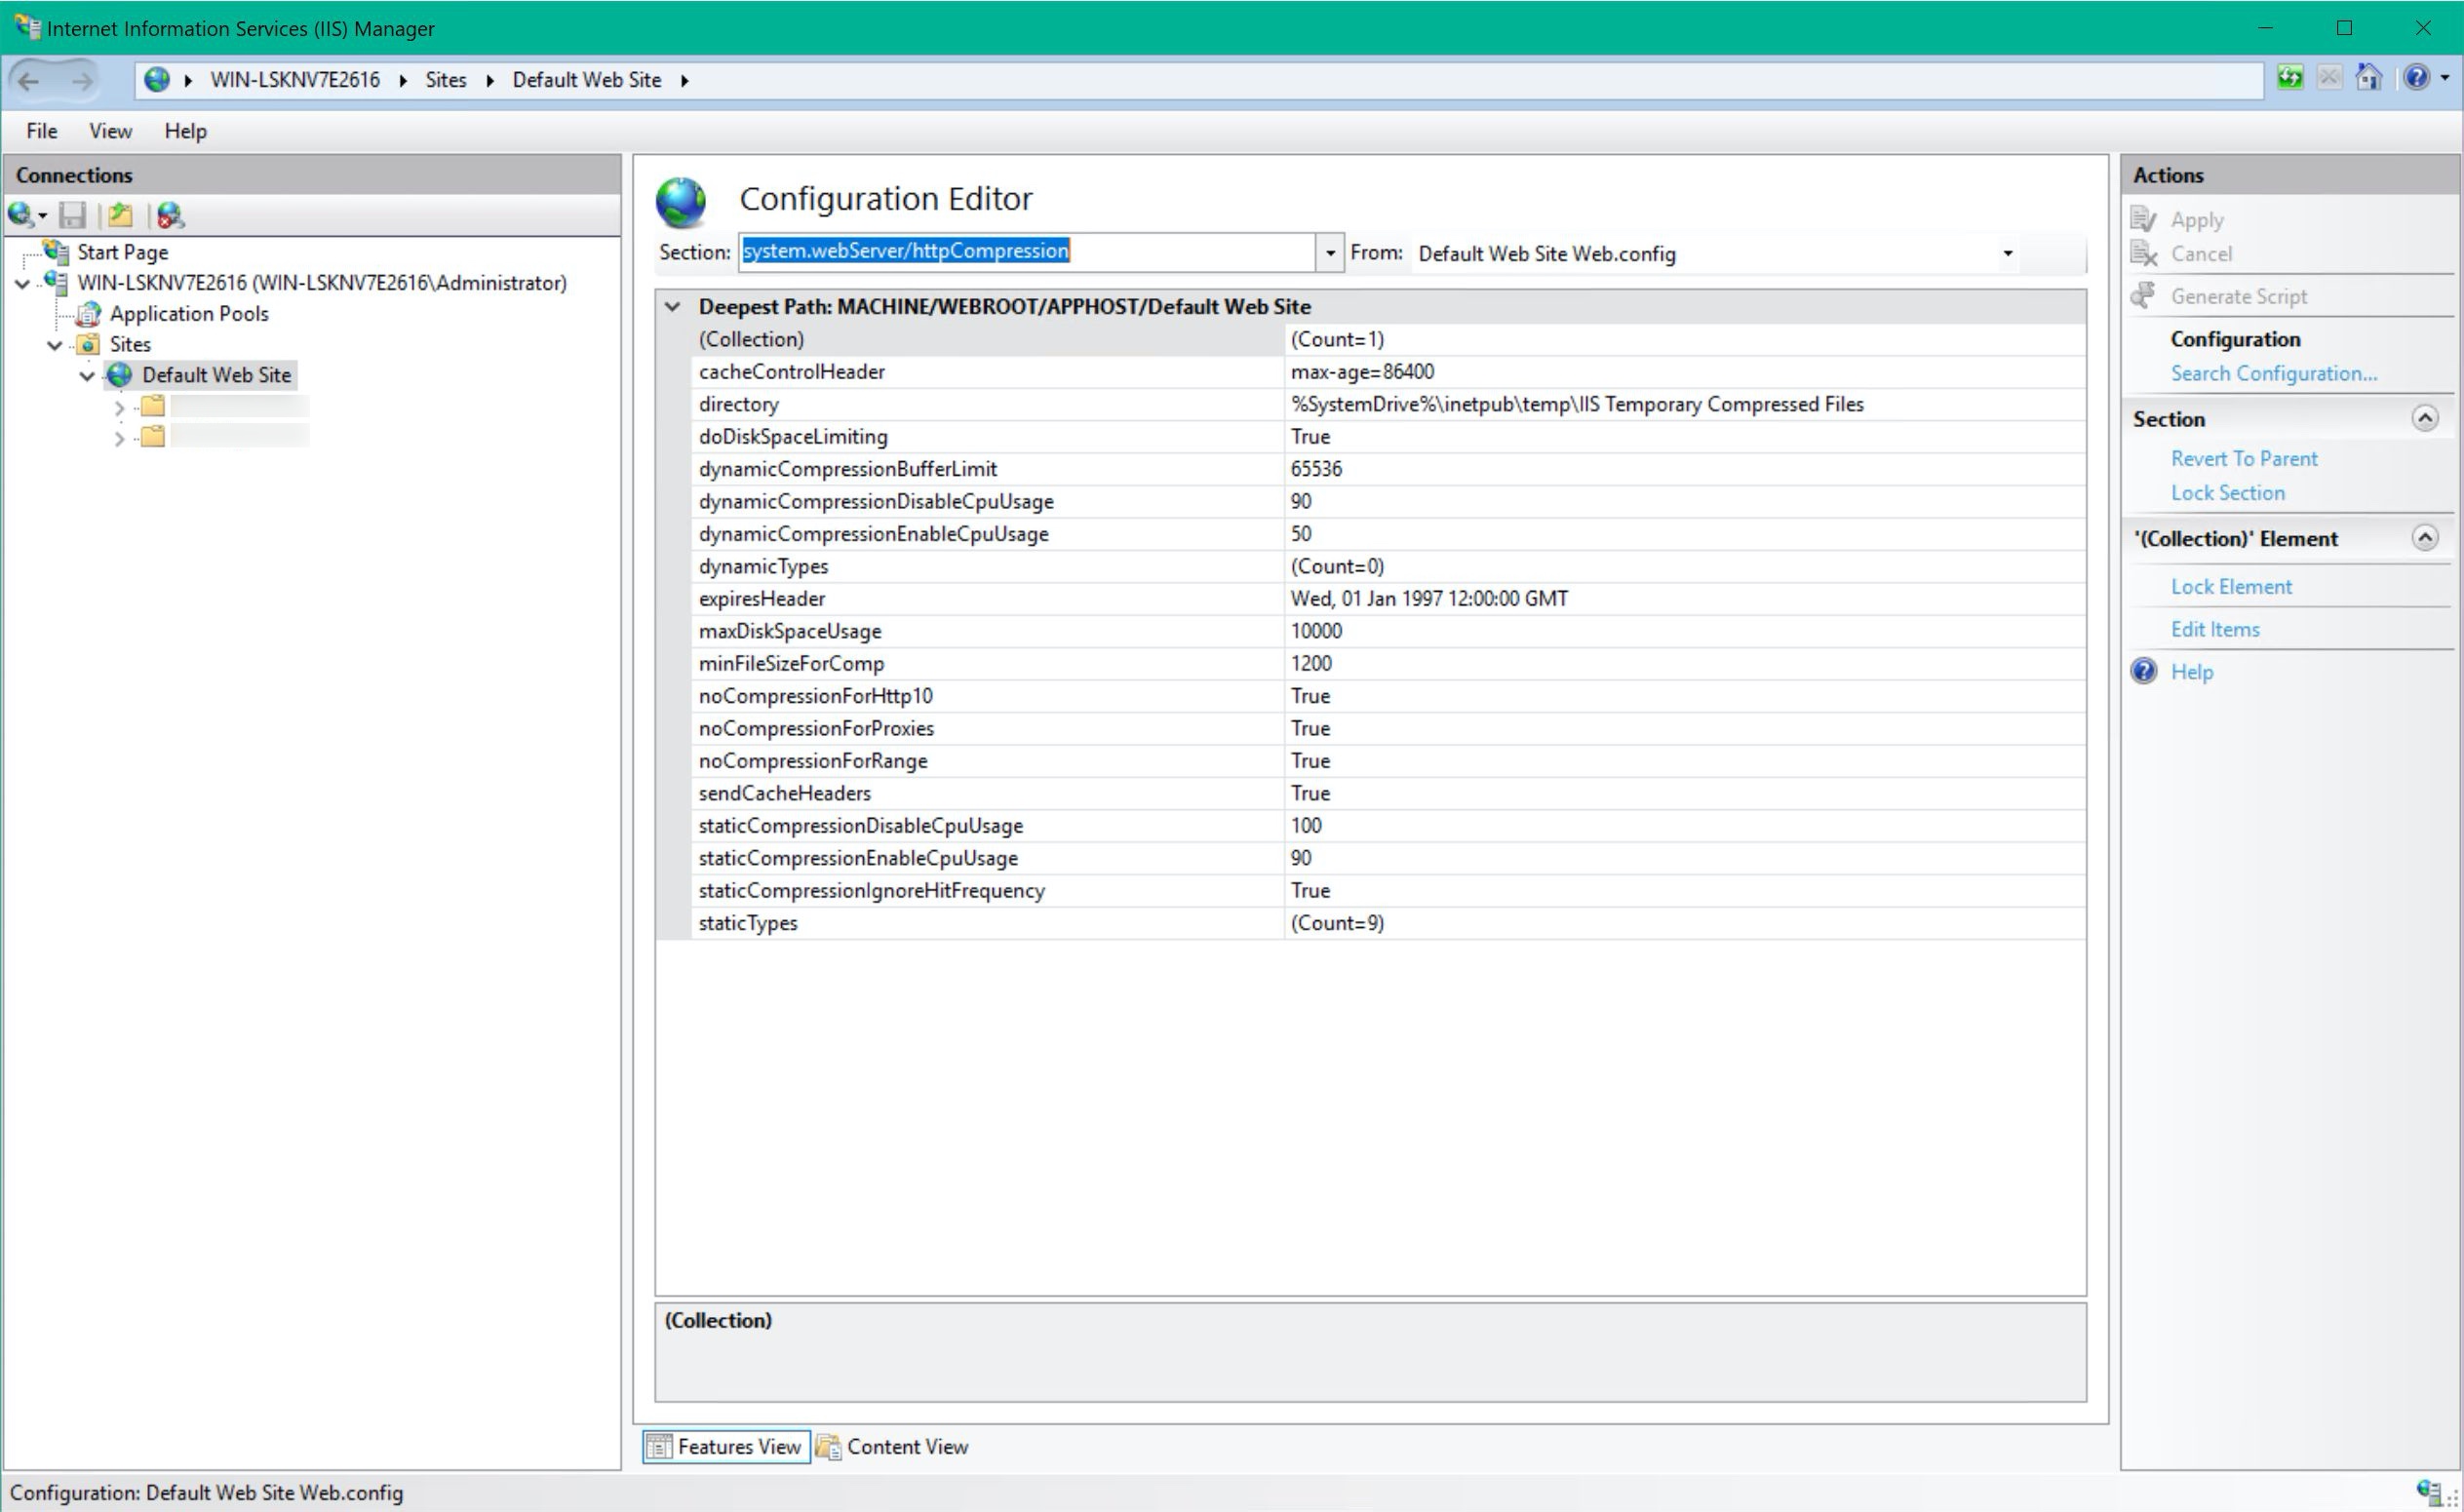
- increase the
maxDiskSpaceUsage, as the default value of 100 MB is way too small when you expect to serve more than 800 MB. As I understood, that is the space that IIS will be using for storing already compressed data (there will be more information about this later) - change
staticCompressionIgnoreHitFrequencyfromFalsetoTrue - add
application/octet-streamandapplication/wasmtostaticTypes
The same configuration can be set directly in the root web.config:
<?xml version="1.0" encoding="UTF-8"?>
<configuration>
    <system.webServer>
        <urlCompression doStaticCompression="true" />
        <serverRuntime frequentHitThreshold="1" frequentHitTimePeriod="10000.00:00:00" />
        <httpCompression maxDiskSpaceUsage="10000" staticCompressionIgnoreHitFrequency="true" staticCompressionEnableCpuUsage="90">
            <staticTypes>
                <add mimeType="application/octet-stream" enabled="true" />
                <add mimeType="application/wasm" enabled="true" />
            </staticTypes>
        </httpCompression>
    </system.webServer>
</configuration>
Apache
Edit the config (c:\path\to\apache\conf\httpd.conf or /etc/apache2/apache2.conf):
# ...

# most likely you'll need to enable these modules only on Windows,
# as on Linux they will be enabled by default
LoadModule deflate_module modules/mod_deflate.so
LoadModule filter_module modules/mod_filter.so

# ...

<IfModule mod_deflate.c>
  DeflateCompressionLevel 6
  AddOutputFilterByType DEFLATE application/javascript
  AddOutputFilterByType DEFLATE application/rss+xml
  AddOutputFilterByType DEFLATE application/xml
  AddOutputFilterByType DEFLATE font/opentype
  AddOutputFilterByType DEFLATE font/otf
  AddOutputFilterByType DEFLATE font/ttf
  AddOutputFilterByType DEFLATE image/svg+xml
  AddOutputFilterByType DEFLATE text/css
  AddOutputFilterByType DEFLATE text/html
  AddOutputFilterByType DEFLATE text/javascript
  AddOutputFilterByType DEFLATE text/plain
  AddOutputFilterByType DEFLATE text/xml
  AddOutputFilterByType DEFLATE application/wasm
  AddOutputFilterByType DEFLATE application/octet-stream
</IfModule>
NGINX
Edit the config (c:\path\to\nginx\conf\nginx.conf or /etc/nginx/nginx.conf):
# ...

worker_processes 4;

# ...

http {

    # ...

    gzip on;
    gzip_types text/plain text/css application/json application/javascript text/xml application/xml application/xml+rss application/wasm application/octet-stream;
    gzip_min_length 10240;
    gzip_comp_level 6;
    gzip_buffers 16 8k;
    #gzip_proxied no-cache no-store private expired auth;
    #gzip_vary on;

    # ...
}
And mime.types just in case:
# ...

types {
    text/html            html htm shtml;
    text/css             css;
    # ...                ...
    application/wasm     wasm;
}
Testing web servers
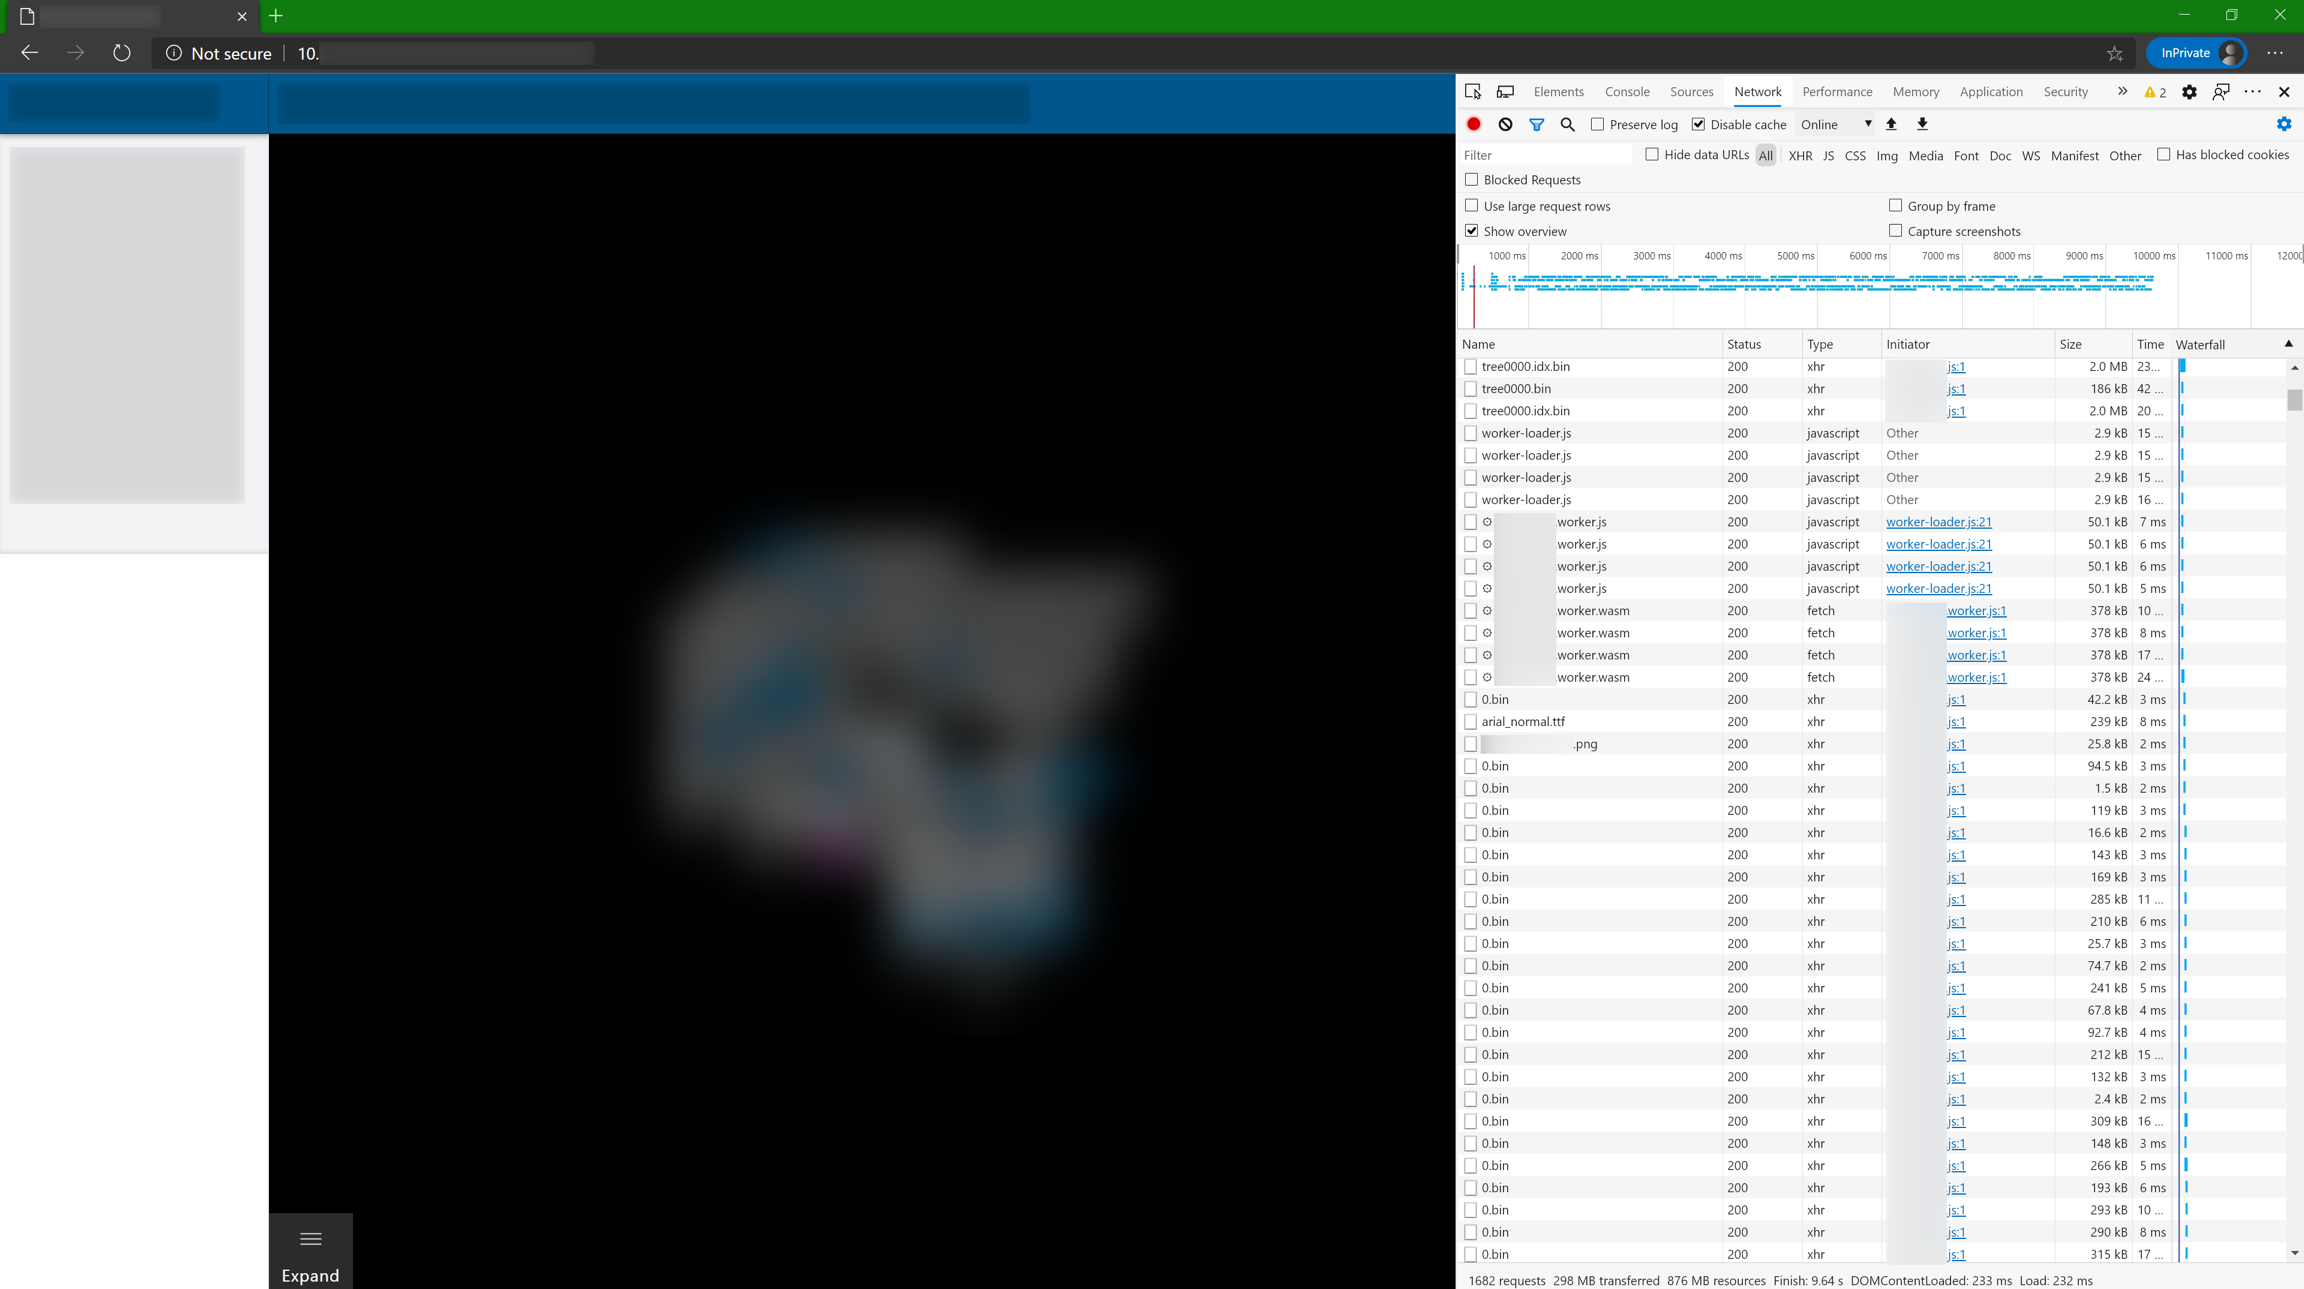
Here’s how the tests were ran. The web application was reloaded 5 times first with no compression enabled on web server, and then again reloaded 5 times but this time with compression enabled on web server.
The following things were measured:
- total amount of data transferred
- the time to load the page and all the associated data (all the 3D models on the scene)
- the CPU utilization during compression
Just in case, here’s a screenshot of testing in progress:
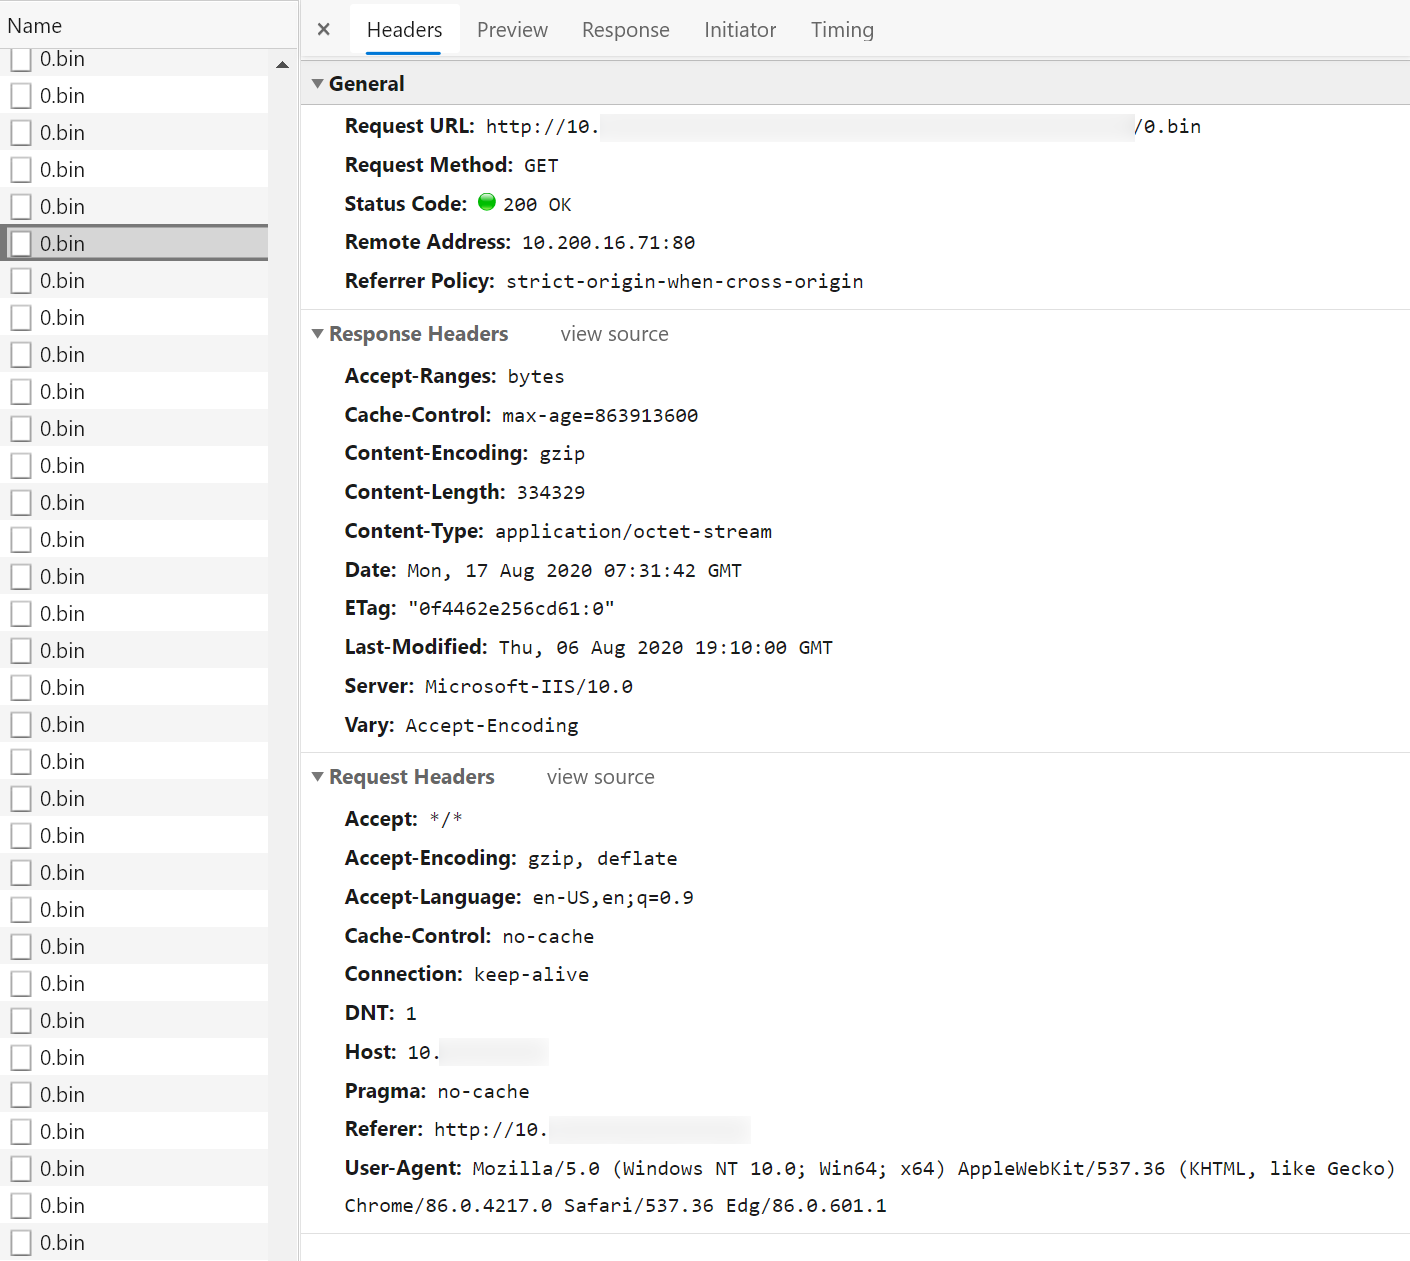
And here goes a single request for binary data:
About compression level
Naturally, you will face a tradeoff between compression ratio and compression time. This is controlled by the compression level: the higher the level, the smaller will be the transferred data, but also the longer it will take to serve the data (though it also depends on the connection speed, the amount of files and the latency) and the higher will be the CPU utilization.
The latter you should definitely keep in mind, as on higher compression levels the CPU load will be very significant, especially when you have a lot of connected clients, and every request needs to be compressed “on the fly”.
So if you only care about minimizing the transferred data, then you should try setting higher compression levels. But if the application load time and server performance are more important, then you should lower the compression level.
While with NGINX and Apache compression level values are fairly easy to find and change, in case of IIS it is a bit more complicated.
Results
Windows
IIS
No compression
| Requests | Transferred, MB | Loading time, sec | |
|---|---|---|---|
| test #1 | 1683 | 876/876 | 10.79 |
| test #2 | 1683 | 876/876 | 10.72 |
| test #3 | 1683 | 876/876 | 11.05 |
| test #4 | 1683 | 876/876 | 11.04 |
| test #5 | 1683 | 876/876 | 11.11 |
| average | 10.94 | ||
With compression
IIS turned out to be smart enough to store already compressed data for future use, so on first request the data is compressed, but all the consequent requests get already compressed data from the first request! That helps with the load time dramatically and saves a lot of CPU utilization.
You can check it yourself - find the folder specified in system.webServer/httpCompression/directory parameter (default value should be %SystemDrive%\inetpub\temp\IIS Temporary Compressed Files) and watch its contents.
So with IIS the tests were ran twice, in the following manner.
First with clearing the folder with pre-compressed data and restarting the website after each full page load:
| Requests | Transferred, MB | Loading time, sec | |
|---|---|---|---|
| test #1 | 1683 | 298/876 | 38.26 |
| test #2 | 1683 | 300/876 | 34.37 |
| test #3 | 1683 | 299/876 | 33.51 |
| test #4 | 1683 | 300/876 | 33.58 |
| test #5 | 1683 | 300/876 | 33.31 |
| average | 34.61 | ||
CPU usage was around 85%.
And then with generating pre-compressing the data on the first load and taking measurements with pre-compressed data:
| Requests | Transferred, MB | Loading time, sec | |
|---|---|---|---|
| test #1 | 1683 | 298/876 | 9.50 |
| test #2 | 1682 | 298/876 | 9.63 |
| test #3 | 1683 | 298/876 | 9.79 |
| test #4 | 1682 | 298/876 | 9.91 |
| test #5 | 1683 | 298/876 | 9.62 |
| average | 9.69 | ||
No CPU utilization was observed.
Apache
No compression
| Requests | Transferred, MB | Loading time, sec | |
|---|---|---|---|
| test #1 | 1683 | 876/876 | 11.20 |
| test #2 | 1683 | 876/876 | 11.15 |
| test #3 | 1683 | 876/876 | 11.28 |
| test #4 | 1683 | 876/876 | 11.26 |
| test #5 | 1683 | 876/876 | 11.29 |
| average | 11.24 | ||
With compression
| Requests | Transferred, MB | Loading time, sec | |
|---|---|---|---|
| test #1 | 1683 | 306/876 | 21.29 |
| test #2 | 1683 | 306/876 | 21.83 |
| test #3 | 1683 | 306/876 | 21.87 |
| test #4 | 1683 | 306/876 | 22.19 |
| test #5 | 1683 | 306/876 | 21.52 |
| average | 21.74 | ||
CPU usage was around 82%.
NGINX
No compression
| Requests | Transferred, MB | Loading time, sec | |
|---|---|---|---|
| test #1 | 1682 | 876/876 | 12.08 |
| test #2 | 1683 | 876/876 | 11.40 |
| test #3 | 1683 | 876/876 | 11.50 |
| test #4 | 1683 | 876/876 | 11.75 |
| test #5 | 1683 | 876/876 | 11.52 |
| average | 11.65 | ||
With compression
Surprisingly, 1 worker or 4 workers didn’t make any difference (you’ll see why that’s important later in the Linux tests).
| Requests | Transferred, MB | Loading time, sec | |
|---|---|---|---|
| test #1 | 1683 | 298/876 | 56.89 |
| test #2 | 1683 | 298/876 | 57.90 |
| test #3 | 1683 | 298/876 | 56.91 |
| test #4 | 1683 | 298/876 | 57.51 |
| test #5 | 1683 | 298/876 | 57.47 |
| average | 57.34 | ||
And CPU usage was around 28%. That is also very different from what you’ll see later on Linux.
Linux
Apache
No compression
| Requests | Transferred, MB | Loading time, sec | |
|---|---|---|---|
| test #1 | 1683 | 874/876 | 10.63 |
| test #2 | 1683 | 874/876 | 10.66 |
| test #3 | 1683 | 874/876 | 10.56 |
| test #4 | 1683 | 874/876 | 10.31 |
| test #5 | 1683 | 874/876 | 10.74 |
| average | 10.58 | ||
I have no idea where 2 MB (874/876) went to, but that’s what browser reported to me.
With compression
| Requests | Transferred, MB | Loading time, sec | |
|---|---|---|---|
| test #1 | 1683 | 306/876 | 18.91 |
| test #2 | 1683 | 306/876 | 19.16 |
| test #3 | 1683 | 306/876 | 18.93 |
| test #4 | 1683 | 306/876 | 18.99 |
| test #5 | 1683 | 306/876 | 18.69 |
| average | 18.94 | ||
CPU load was about 75%.
NGINX
No compression
| Requests | Transferred, MB | Loading time, sec | |
|---|---|---|---|
| test #1 | 1682 | 876/876 | 10.47 |
| test #2 | 1683 | 876/876 | 11.14 |
| test #3 | 1683 | 876/876 | 10.92 |
| test #4 | 1683 | 876/876 | 11.13 |
| test #5 | 1683 | 876/876 | 10.74 |
| average | 10.88 | ||
With compression
And here comes the difference with Windows. In case of 1 worker, the CPU load is 100% and the results are:
| Requests | Transferred, MB | Loading time, sec | |
|---|---|---|---|
| test #1 | 1683 | 298/876 | 49.69 |
| test #2 | 1683 | 298/876 | 49.42 |
| test #3 | 1683 | 298/876 | 49.85 |
| test #4 | 1683 | 298/876 | 49.49 |
| test #5 | 1683 | 298/876 | 49.25 |
| average | 49.54 | ||
And with 4 workers the CPU load is 75% and the results are:
| Requests | Transferred, MB | Loading time, sec | |
|---|---|---|---|
| test #1 | 1683 | 298/876 | 18.94 |
| test #2 | 1683 | 298/876 | 19.10 |
| test #3 | 1683 | 298/876 | 18.68 |
| test #4 | 1683 | 298/876 | 19.49 |
| test #5 | 1683 | 298/876 | 18.31 |
| average | 18.90 | ||
So either there is a bug with NGINX workers on Windows, or it’s either of the two.
Conclusion
Here’s the final table with everything in one place:
| Platform | Web server | No compression, sec | With compression, sec | Transferred, MB | CPU utilization |
|---|---|---|---|---|---|
| Windows | IIS | 10.94 | 9.69 | 298 | - |
| Windows | Apache | 11.24 | 21.74 | 306 | 82% |
| Windows | NGINX | 11.65 | 57.34 | 298 | 28% |
| Linux | Apache | 10.58 | 18.94 | 306 | 75% |
| Linux | NGINX | 10.88 | 18.90 | 298 | 75% |
As it turns out, on Windows IIS provides the best results - simply because it compresses the data only once, on first request, and then all the consequent requests get already pre-compressed data, so you have everything: minimal amount of transferred data, faster loading and barely any CPU utilization.
Neither NGINX nor Apache have this, as they compress the data “on the fly” for every request and do not store and re-use already compressed data from previous requests. Even though it is certainly possible to manually compress the data beforehand, that would require some additional effort and further configuration tweaking, while with IIS the whole thing “just works” almost out of the box.
On Linux platform, however, IIS is not present, so the choice is between NGINX and Apache. From the tests results above NGINX has shown a bit higher compression ratio, so if you are after minimizing the transferred data, NGINX might be a better choice for bigger datasets, though I guess the only way to say for sure is by performing your own tests with your particular data.