matplotlib animation on Mac OS
I’ve got a weird problem with one of my Python scripts. It creates a chart with animation, and this animation works fine on Windows and Linux, but on Mac OS it just doesn’t show up. Here’s a video demonstration:
If video doesn’t play in your browser, you can download it here.
Problem
The full script is published here.
To run the script I installed only matplotlib and numpy packages, so the environment on all 3 systems (Windows, Linux, Mac OS) should be the same. Just in case, here they are:
# Windows (10.19041.450, x64)

- Python 3.7.2
- matplotlib 3.3.1
- numpy 1.19.1

# Linux (Ubuntu 20.04.1, x64)

- Python 3.8.2
- matplotlib 3.3.1
- numpy 1.19.1

# Mac OS (10.15.6, x64)

- Python 3.8.5
- matplotlib 3.3.1
- numpy 1.19.1
I’ve tried other simple plot animation samples (for instance, the ones from matplotlib documentation), and all of them work fine on Mac OS, so there has to be something wrong with my particular script. However, the fact that this very same script works on Windows and Linux confused me a lot. As a side note, you might have noticed that animation speed is different between Windows and Linux (the latter is faster), and I’ve no idea what could be the reason of that either, though it’s not so important here.
I’ve also tested my script on 3 other Macs with different Mac OS and Python versions installed, just to make sure that it’s not my environment who messes things up, but it was the same on all of them - no animation showing up.
Solution
After submitting a question at Stack Overflow and also at matplotlib forum, I thought about reading the documentation (classic).
The right backend
There I soon enough discovered the backends section. That helped me to google some more ideas, for instance this answer shown what’s needed to make animation from my script work in Jupyter notebook - just a single line in the very beginning of the script:
%matplotlib Tk
import numpy as np
import matplotlib.pyplot as plt
import matplotlib.animation as animation
# ...
And then animation started to work. Okay, so what backend does Jupyter uses in this case then:
print("backend:", plt.rcParams["backend"])It returned TkAgg - so that’s what can show animations in my script! Now I only need to set the same backend in my standalone script.
By the way, if you are curious, without %matplotlib Tk Jupyter reports module://ipykernel.pylab.backend_inline value for backend.
With pyplot.rcParams
Using the same print statement, I’ve discovered what backend is used by default when running my script in terminal: MacOSX. Right then, so this backend is incapable to run my animation for some reason. But since I now know the backend that is capable, I’ve set it like this:
import numpy as np
import matplotlib.pyplot as plt
import matplotlib.animation as animation
import math

print("backend", plt.rcParams["backend"])
plt.rcParams["backend"] = "TkAgg"
print("backend", plt.rcParams["backend"])
But even though it reported a new backend in the output, the animation still wasn’t showing up:
So setting the backend via plt.rcParams["backend"] isn’t supported? That’s a bit unexpected, as according to the documentation, it should be.
With matplotlib.use
Anyway, after some more googling I’ve found this answer, and that was what finally worked:
import matplotlib
import numpy as np
import matplotlib.pyplot as plt
import matplotlib.animation as animation
import math
print("backend", plt.rcParams["backend"])
#plt.rcParams["backend"] = "TkAgg" # doesn't actually set the backend
matplotlib.use("TkAgg")
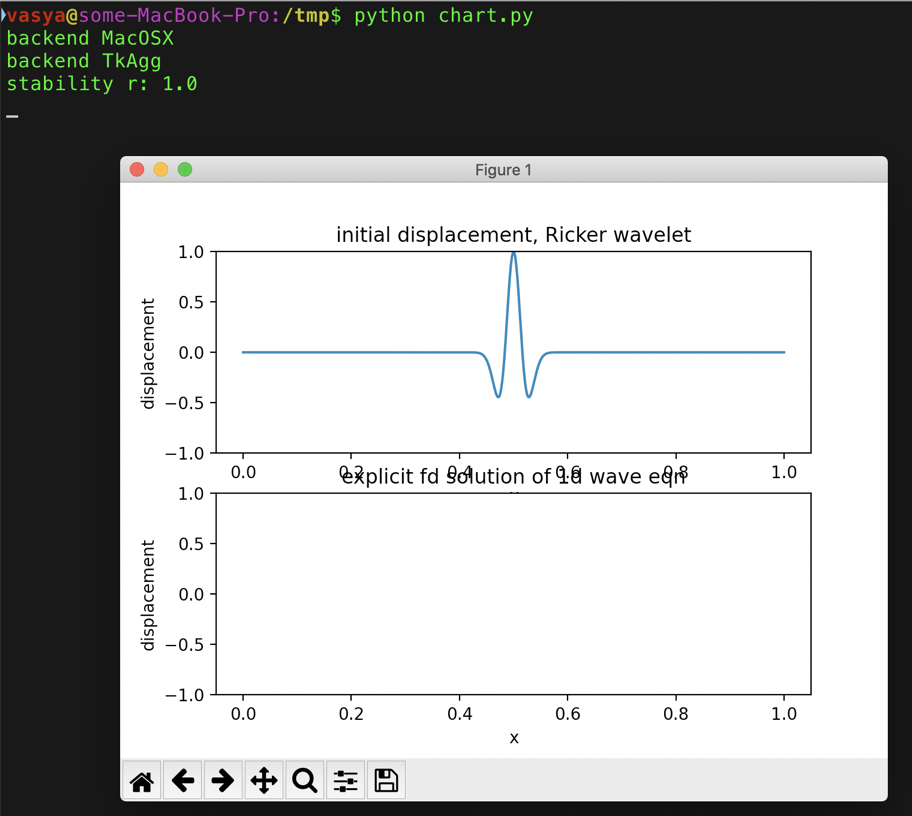
print("backend", plt.rcParams["backend"])Now my script runs and shows the animation. It also prints the following warning to the output:
$ python chart.py
backend MacOSX
backend TkAgg
stability r: 1.0
DEPRECATION WARNING: The system version of Tk is deprecated and may be removed in a future release. Please don't rely on it. Set TK_SILENCE_DEPRECATION=1 to suppress this warning.
…which is due to the fact that default Tcl/Tk on Mac OS is outdated (8.5 at the moment), and if you (like me) are getting Python from Homebrew, then it won’t be trivial to link it with the latest version of Tcl/Tk. But for now it works as it is, so it’s all good for the time being.
As it was pointed out in the bugreport, the line is added anew to the plot each time inside animate() function, instead of modifying existing line, and that’s what was causing the chart to go all rainbowy.
After fixing the script like this:
line, = ax[1].plot(x, u)

def animate(it):
    global tmp0, tmp1
    # predict u in the next time step
    u[free] = 2 * tmp1 - tmp0 - c2 * np.dot(A, tmp1)
    # update the previous time steps
    tmp0 = tmp1
    tmp1 = u[free]
    line.set_xdata(x)
    line.set_ydata(u)
    return line,
I now get the following result even with default MacOSX backend:
If video doesn’t play in your browser, you can download it here.
Almost good, except for this horizontal line (by the way, it’s not present with TkAgg backend). Setting blit=False gets rid of this line, and also causes the animation to play considerably slower (but that’s not really a problem).